
In this tutorial, we will explain how to integrate Prometheus with Alertmanager for advanced alerting on Ubuntu 26.04. Prometheus is an open-source monitoring system that collects metrics from servers, applications, and services, while Alertmanager is responsible for processing, grouping, and sending notifications whenever an alert is triggered. Together, they provide a complete monitoring solution that helps administrators detect problems early and respond before they affect production environments. Alertmanager supports multiple notification channels, including email, Slack, Microsoft Teams, PagerDuty, and webhooks, making it suitable for both small deployments and enterprise infrastructures.
Learning to integrate Prometheus with Alertmanager on Ubuntu 26.04 is a straightforward process that can be completed in about 20 minutes. Let’s get started!
Table of Contents
Prerequisites
- A server with Linux installed
- User privileges: root or a non-root user with sudo privileges
Step 1. Install Alertmanager
Alertmanager is a component of the Prometheus ecosystem that receives alerts generated by Prometheus. It can group similar alerts, remove duplicate notifications, silence alerts during maintenance windows, and route notifications to different receivers based on custom rules.

Before downloading Alertmanager, update the package index to ensure your system is using the latest available package information:
apt update -y && apt upgrade -y
Next, download the latest Alertmanager release from the official Prometheus project:
cd /tmp

wget https://github.com/prometheus/alertmanager/releases/download/v0.29.0/alertmanager-0.29.0.linux-amd64.tar.gz
Extract the downloaded archive:
tar -xzf alertmanager-0.29.0.linux-amd64.tar.gz
Move the Alertmanager binaries to a directory included in the system PATH:
cp alertmanager-0.29.0.linux-amd64/alertmanager /usr/local/bin/

cp alertmanager-0.29.0.linux-amd64/amtool /usr/local/bin/

chmod +x /usr/local/bin/alertmanager

chmod +x /usr/local/bin/amtool
Create a dedicated system user that will run the Alertmanager service:
useradd --no-create-home --shell /bin/false alertmanager
Next, create the directories required for Alertmanager configuration and runtime data:
mkdir -p /etc/alertmanager

mkdir -p /var/lib/alertmanager
Copy the default configuration file to the configuration directory:
cp alertmanager-0.29.0.linux-amd64/alertmanager.yml /etc/alertmanager/
Assign the correct ownership so the Alertmanager service can access its files:
chown -R alertmanager:alertmanager /etc/alertmanager

chown -R alertmanager:alertmanager /var/lib/alertmanager
Now create a systemd service that will allow Alertmanager to start automatically whenever the server boots.
Create the alertmanager.serviceservice file inside the /etc/systemd/system directory:
nano /etc/systemd/system/alertmanager.service
Add the following configuration:
[Unit]
Description=Prometheus Alertmanager
Wants=network-online.target
After=network-online.target

[Service]
User=alertmanager
Group=alertmanager

Type=simple

ExecStart=/usr/local/bin/alertmanager \
--config.file=/etc/alertmanager/alertmanager.yml \
--storage.path=/var/lib/alertmanager \
--cluster.listen-address=""

Restart=always

[Install]
WantedBy=multi-user.target
Save the file and exit the editor.
Reload the systemd daemon so it recognizes the newly created service:
systemctl daemon-reload
Start the Alertmanager service and configure it to launch automatically after every reboot:
systemctl start alertmanager && systemctl enable alertmanager
Verify that the service is running:
systemctl status alertmanager
If everything is working correctly, you should see output similar to the following:
root@host:/tmp# systemctl status alertmanager -l
● alertmanager.service - Prometheus Alertmanager
     Loaded: loaded (/etc/systemd/system/alertmanager.service; enabled; preset: enabled)
     Active: active (running) since Wed 2026-07-22 17:20:11 CDT; 2s ago
 Invocation: c7b8634c511649a9925b608605c48d13
   Main PID: 25292 (alertmanager)
      Tasks: 9 (limit: 3770)
     Memory: 13.8M (peak: 13.8M)
        CPU: 229ms
     CGroup: /system.slice/alertmanager.service
             └─25292 /usr/local/bin/alertmanager --config.file=/etc/alertmanager/alertmanager.yml --storage.path=/var/lib/alertmanager --cluster.listen-address=
Step 2. Configure Alertmanager
Before we integrate Prometheus with Alertmanager, we need to configure Alertmanager. Next, configure how it handles notifications. Alertmanager allows you to define receivers, notification routes, grouping rules, and alert timing. In this example, we’ll configure a simple email receiver that will send notifications whenever Prometheus detects a problem.
Open the default Alertmanager configuration file:
nano /etc/alertmanager/alertmanager.yml
Replace the existing configuration with the following example. Replace the email address, SMTP server, username, and password with your own values.
global:
  smtp_smarthost: 'smtp.example.com:587'
  smtp_from: 'monitor@example.com'
  smtp_auth_username: 'monitor@example.com'
  smtp_auth_password: 'YourPassword'

route:
  receiver: email-notifications
  group_wait: 30s
  group_interval: 5m
  repeat_interval: 1h

receivers:
  - name: email-notifications
    email_configs:
      - to: admin@example.com
        send_resolved: true
This configuration instructs Alertmanager to send all incoming alerts to the specified email address. It also groups similar alerts to reduce notification noise and avoids sending repeated alerts too frequently.
Save the file and exit the editor. The Alertmanager configuration is now ready, and in the next section we’ll configure Prometheus to forward alerts to the Alertmanager service.
Step 3. Install Prometheus
Alertmanager is done. The next step to integrate Prometheus with Alertmanager is to actually install Prometheus. Prometheus is an open-source monitoring system designed to collect and store metrics from servers, applications, and services. In this setup, Prometheus will collect monitoring data and later forward generated alerts to Alertmanager for notification processing.
Before starting the installation, update the system packages:
apt update -y && apt upgrade -y
Next, create a dedicated system user that will run the Prometheus service. Running Prometheus with a separate user improves security because the service does not need root privileges.
useradd --no-create-home --shell /bin/false prometheus
Create the directories required for Prometheus configuration files and stored metrics:
mkdir /etc/prometheus

mkdir /var/lib/prometheus
The /etc/prometheus directory will store the Prometheus configuration files, while /var/lib/prometheus will contain the collected time-series database.
Download the latest Prometheus release from the official Prometheus GitHub repository:
cd /tmp

wget https://github.com/prometheus/prometheus/releases/download/v3.5.0/prometheus-3.5.0.linux-amd64.tar.gz
Extract the downloaded archive:
tar -xzf prometheus-3.5.0.linux-amd64.tar.gz
Navigate to the extracted Prometheus directory:
cd prometheus-3.5.0.linux-amd64
Copy the Prometheus binaries to /usr/local/bin so they can be executed system-wide:
cp prometheus /usr/local/bin/

cp promtool /usr/local/bin/
Set the correct executable permissions:
chmod +x /usr/local/bin/prometheus

chmod +x /usr/local/bin/promtool
Verify that Prometheus was installed successfully:
prometheus --version
You should see output similar to:
prometheus, version 3.5.0
Copy the default Prometheus configuration file to the configuration directory:
cp prometheus.yml /etc/prometheus/
Assign the correct ownership to the Prometheus files:
chown -R prometheus:prometheus /etc/prometheus

chown -R prometheus:prometheus /var/lib/prometheus
Now edit the Prometheus configuration file:
nano /etc/prometheus/prometheus.yml
For a basic installation, use the following configuration:
global:
  scrape_interval: 15s

scrape_configs:
  - job_name: "prometheus"
    static_configs:
      - targets:
          - "localhost:9090"
This configuration allows Prometheus to monitor its own service. You can add additional monitoring targets, such as Node Exporter or application metrics, later.
Before creating the system service, validate the Prometheus configuration:
promtool check config /etc/prometheus/prometheus.yml

If the configuration is valid, you should receive the following output:
Checking /etc/prometheus/prometheus.yml
SUCCESS: /etc/prometheus/prometheus.yml is valid prometheus config file syntax
Next, create a systemd service file so Prometheus can start automatically during system boot:
nano /etc/systemd/system/prometheus.service
Add the following configuration:
[Unit]
Description=Prometheus Monitoring System
Wants=network-online.target
After=network-online.target

[Service]
User=prometheus
Group=prometheus

Type=simple

ExecStart=/usr/local/bin/prometheus \
--config.file=/etc/prometheus/prometheus.yml \
--storage.tsdb.path=/var/lib/prometheus \
--web.console.templates=/etc/prometheus/consoles \
--web.console.libraries=/etc/prometheus/console_libraries

Restart=always

[Install]
WantedBy=multi-user.target
Save the file and exit the editor.
Reload the systemd daemon to apply the new service configuration:
systemctl daemon-reload
Start the Prometheus service and enable it to start automatically after reboot:
systemctl start prometheus && systemctl enable prometheus
Verify that Prometheus is running correctly:
systemctl status prometheus

If everything is configured correctly, you should see output similar to the following:
root@host:/tmp/prometheus-3.5.0.linux-amd64# systemctl status prometheus
● prometheus.service - Prometheus Monitoring System
     Loaded: loaded (/etc/systemd/system/prometheus.service; enabled; preset: enabled)
     Active: active (running) since Wed 2026-07-22 17:32:22 CDT; 13s ago
 Invocation: 0dc48b320e8549368342d98e4eab94a9
   Main PID: 25732 (prometheus)
      Tasks: 8 (limit: 3770)
     Memory: 19.1M (peak: 19.1M)
        CPU: 212ms
     CGroup: /system.slice/prometheus.service
             └─25732 /usr/local/bin/prometheus --config.file=/etc/prometheus/prometheus.yml --storage.tsdb.path=/var/lib/prometheus --web.console.templates=/etc/prometheus/consoles --web.console.libraries=/etc/prometheus/cons
ole_libraries
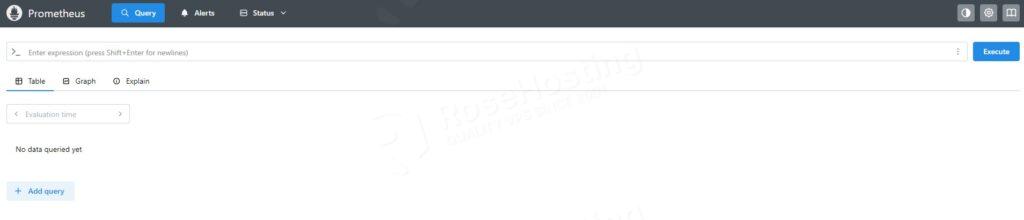
Prometheus is now installed and available through the web interface:
http://YOUR_SERVER_IP:9090
Open the Prometheus dashboard in your browser and navigate to Status → Targets. The Prometheus target should appear with the status UP, confirming that the monitoring service is working correctly.
Step 4. Configure Prometheus to Use Alertmanager
Now that Alertmanager has been configured, the next step is to integrate Prometheus with Alertmanager. This allows Prometheus to forward every triggered alert to Alertmanager, where it can be processed and delivered to the appropriate notification receiver.
Open the Prometheus configuration file using your preferred text editor:
nano /etc/prometheus/prometheus.yml
Locate the alerting section. If it does not already exist, add the following configuration:
alerting:
  alertmanagers:
    - static_configs:
      - targets: ["localhost:9093"]
Next, configure Prometheus to load your alerting rules by adding the following section near the bottom of the configuration file:
rule_files:
  - "alert.rules.yml"
This configuration instructs Prometheus to communicate with the Alertmanager service running on port 9093 and load all alert definitions from the alert.rules.yml file.
Step 5. Create Alerting Rules
Now that you’ve managed to integrate Prometheus with Alertmanager, it’s time to create alert rules. Prometheus evaluates alerting rules at regular intervals. Whenever a rule evaluates to true for a specified amount of time, Prometheus generates an alert and sends it to Alertmanager.
Create a new alert rules file inside the Prometheus configuration directory:
nano /etc/prometheus/alert.rules.yml
Add the following example rule:
groups:
- name: server-alerts
  rules:
  - alert: InstanceDown
    expr: up == 0
    for: 1m
    labels:
      severity: critical
    annotations:
      summary: "Instance Down"
      description: "A monitored target has been unreachable for more than one minute."
This rule monitors the built-in up metric that Prometheus automatically collects from every configured target. If a target becomes unavailable for more than one minute, Prometheus generates a critical alert and forwards it to Alertmanager.
You can create multiple alerting rules for different scenarios, such as high CPU usage, low disk space, excessive memory consumption, or unavailable services. Organizing related alerts into groups makes the configuration easier to manage as your monitoring environment grows.
Step 5. Restart the Services
Before restarting Prometheus, it is recommended to verify that the configuration files do not contain any syntax errors.
Run the following command to validate the Prometheus configuration:
promtool check config /etc/prometheus/prometheus.yml
If the configuration is valid, you should receive output similar to the following:
Checking /etc/prometheus/prometheus.yml
  SUCCESS: 1 rule files found
 SUCCESS: /etc/prometheus/prometheus.yml is valid prometheus config file syntax

Checking /etc/prometheus/alert.rules.yml
  SUCCESS: 1 rules found
Next, verify the alert rules file:
promtool check rules /etc/prometheus/alert.rules.yml
If the rule file is valid, the output should look similar to this:
Checking /etc/prometheus/alert.rules.yml
  SUCCESS: 1 rules found
Now restart both services so the new configuration is loaded:
systemctl restart alertmanager && systemctl restart prometheus
Verify that both services are running correctly:
systemctl status alertmanager && systemctl status prometheus
If both services are active, the integration has been completed successfully.
Step 6. Install Node Exporter
Node Exporter is a Prometheus exporter that collects hardware and operating system metrics from Linux servers. It provides information about CPU usage, memory consumption, disk space, filesystem status, network traffic, and other system-level statistics.
Prometheus does not collect these metrics directly from the operating system. Instead, it periodically connects to Node Exporter and retrieves the available metrics through its HTTP endpoint.
Create a dedicated system user for Node Exporter:
useradd --no-create-home --shell /bin/false node_exporter
Download the latest Node Exporter release:
cd /tmp

wget https://github.com/prometheus/node_exporter/releases/download/v1.9.1/node_exporter-1.9.1.linux-amd64.tar.gz
Extract the downloaded archive:
tar -xzf node_exporter-1.9.1.linux-amd64.tar.gz
Copy the Node Exporter binary to the system path:
cp node_exporter-1.9.1.linux-amd64/node_exporter /usr/local/bin/
Set the correct permissions:
chmod +x /usr/local/bin/node_exporter
Verify that Node Exporter was installed successfully:
node_exporter --version
Create a systemd service file:
nano /etc/systemd/system/node_exporter.service
Add the following configuration:
[Unit]
Description=Prometheus Node Exporter
Wants=network-online.target
After=network-online.target

[Service]
User=node_exporter
Group=node_exporter

Type=simple

ExecStart=/usr/local/bin/node_exporter

Restart=always

[Install]
WantedBy=multi-user.target
Save the file and reload systemd:
systemctl daemon-reload
Start Node Exporter and enable it during system boot:
systemctl start node_exporter && systemctl enable node_exporter
Verify that Node Exporter is running:
systemctl status node_exporter
You should get output similar to this:
root@host:/tmp# systemctl status node_exporter
● node_exporter.service - Prometheus Node Exporter
     Loaded: loaded (/etc/systemd/system/node_exporter.service; enabled; preset: enabled)
     Active: active (running) since Wed 2026-07-22 17:40:38 CDT; 5s ago
 Invocation: 785b3ce937d04c4d9fe9e06afcc6635e
   Main PID: 26186 (node_exporter)
      Tasks: 5 (limit: 3770)
     Memory: 3.3M (peak: 3.3M)
        CPU: 29ms
     CGroup: /system.slice/node_exporter.service
             └─26186 /usr/local/bin/node_exporter
Node Exporter exposes system metrics on port 9100. You can verify that it is working by opening:
http://YOUR_SERVER_IP:9100/metrics
Step 7. Test the Alert
You’ve managed to integrate Prometheus and Alertmanager, and set up the alert. Now comes one of the most critical parts. Testing your alert configuration is an important step because it confirms that Prometheus and Alertmanager are communicating correctly. One of the simplest ways to trigger an alert is to temporarily stop a monitored service.
For example, if Prometheus is monitoring Node Exporter, stop the service by running:
systemctl stop node_exporter
After approximately one minute, the InstanceDown alert should become active.
You can verify this by opening the Prometheus web interface:
http://YOUR_SERVER_IP:9090/alerts
The alert should appear with the status FIRING.
At the same time, Alertmanager receives the alert and processes it according to the routing rules defined in alertmanager.yml. If your email settings are configured correctly, you should receive a notification similar to the following:
Alert: InstanceDown

Severity: critical

Description:
A monitored target has been unreachable for more than one minute.
Once the monitored service is started again, Prometheus automatically marks the alert as resolved. Alertmanager can also send a recovery notification if the send_resolved option is enabled in the receiver configuration.
systemctl start node_exporter
Conclusion
Congratulations! You have successfully integrated Prometheus with Alertmanager for advanced alerting on Ubuntu 26.04.
You now have a centralized alerting solution capable of detecting service failures, grouping related alerts, reducing duplicate notifications, and delivering alerts through multiple notification channels. As your infrastructure grows, you can continue expanding your monitoring environment by adding additional exporters, creating custom alert rules, and integrating Alertmanager with collaboration platforms such as Slack, Microsoft Teams, PagerDuty, or custom webhooks.
If you encounter any issues during the configuration process or simply prefer not to perform the setup yourself, we’re here to help. Sign up for one of our VPS hosting plans and open a support ticket. Our Linux administrators are available 24/7 and will be happy to assist you with configuring Prometheus, Alertmanager, and your monitoring infrastructure.
If you found this guide on how to integrate Prometheus with Alertmanager for advanced alerting helpful, feel free to share it with others or leave a comment below.