

The ELK stack is an acronym of three popular open-source projects: Elasticsearch, Logstash, and Kibana. It is an open-source and one of the most popular log management platform that collects, processes, and visualizes data from multiple data sources. It is mainly used for log analysis in IT environments. It is very helpful for a system administrator to search and analyze a large volume of data to make real-time decisions-all the time.
Elasticsearch: It is a search engine used to store all of the collected data.
Kibana: It provides a web-based interface used to search and visualize your data.
Logstash: It is a data processing interface used to collect data from several sources concurrently then sends the data to your desired stash.
In this tutorial, we will explain how to install and configure the ELK stack on Ubuntu 20.04 server.

Table of Contents
Prerequisites
- An Ubuntu 20.04 VPS (we’ll be using our NVMe 8 VPS hosting plan)
- Access to the root user account (or access to an admin account with root privileges)
Log in to the Server & Update the Server OS Packages
First, log in to your Ubuntu 20.04 server via SSH as the root user:
ssh root@IP_Address -p Port_number
You will need to replace ‘IP_Address‘ and ‘Port_number‘ with your server’s respective IP address and SSH port number. Additionally, replace ‘root’ with the username of the admin account if necessary.
Before starting, you have to make sure that all Ubuntu OS packages installed on the server are up to date. You can do this by running the following commands:
apt-get update -y
apt-get upgrade -y
Install Required Dependencies
Before starting, you will need to install Java and other required dependencies in your server. You can install all of them using the following command:
apt-get install openjdk-11-jdk wget apt-transport-https curl gnupg2 -y
Once all the packages are installed, verify the installed version of Java with the following command:
java -version
You should get the following output:
openjdk version "11.0.9.1" 2020-11-04
OpenJDK Runtime Environment (build 11.0.9.1+1-Ubuntu-0ubuntu1.20.04)
OpenJDK 64-Bit Server VM (build 11.0.9.1+1-Ubuntu-0ubuntu1.20.04, mixed mode, sharing)
Install Elasticsearch
By default, Elasticsearch is not available in the Ubuntu standard repository. So you will need to add the Elasticsearch repository to your system.
First, add the Elasticsearch signing key with the following command:
wget -qO - https://artifacts.elastic.co/GPG-KEY-elasticsearch | apt-key add -
Next, add the repository with the following command:
echo "deb https://artifacts.elastic.co/packages/7.x/apt stable main" | tee -a /etc/apt/sources.list.d/elastic-7.x.list
Once the repository is added, update the repository and install the Elasticsearch package with the following command:
apt-get update -y
apt-get install elasticsearch -y
Once the Elasticsearch is installed, start the Elasticsearch service and enable it to start at system reboot:
systemctl start elasticsearch
systemctl enable elasticsearch
At this point, Elasticsearch is started and listening on port 9200. You can verify it with the following command:
ss -antpl | grep 9200
You should get the following output:
LISTEN   0        4096        [::ffff:127.0.0.1]:9200                  *:*       users:(("java",pid=27757,fd=257))
LISTEN   0        4096                     [::1]:9200               [::]:*       users:(("java",pid=27757,fd=256))
You can also check the Elasticsearch by sending an HTTP request:
curl -X GET http://localhost:9200
You should get the following output:
{
  "name" : "ubuntu2004",
  "cluster_name" : "elasticsearch",
  "cluster_uuid" : "LhG8-a_eQHyyoRAlQQXBTQ",
  "version" : {
    "number" : "7.10.0",
    "build_flavor" : "default",
    "build_type" : "deb",
    "build_hash" : "51e9d6f22758d0374a0f3f5c6e8f3a7997850f96",
    "build_date" : "2020-11-09T21:30:33.964949Z",
    "build_snapshot" : false,
    "lucene_version" : "8.7.0",
    "minimum_wire_compatibility_version" : "6.8.0",
    "minimum_index_compatibility_version" : "6.0.0-beta1"
  },
  "tagline" : "You Know, for Search"
}
Install and Configure Logstash
Logstash is a log-parsing software used to collects logs and store them on Elasticsearch. You can install it easily with the following command:
apt-get install logstash -y
Once the Logstash is installed, you will need to configure the input, filter, and the output plugins. You can configure it by creating a new configuration file inside /etc/logstash/conf.d/ directory:
nano /etc/logstash/conf.d/logstash.conf
Add the following lines:
#Specify listening port for incoming logs from the beats

input {
  beats {
    port => 5044
  }
}

# Used to parse syslog messages and send it to Elasticsearch for storing

filter {
  if [type] == "syslog" {
     grok {
        match => { "message" => "%{SYSLOGLINE}" }
  }
     date {
        match => [ "timestamp", "MMM  d HH:mm:ss", "MMM dd HH:mm:ss" ]
     }
  }
}

# Specify an Elastisearch instance

output {
  elasticsearch {
    hosts => ["localhost:9200"]
    index => "%{[@metadata][beat]}-%{+YYYY.MM.dd}"
  }
}
Save and close the file then start the Logstash and enable it to start at system reboot.
systemctl start logstash
systemctl enable logstash
Install and Configure Kibana
Kibana visualizes the data stored on Elasticsearch through a web-based interface. You can install it with the following command:
apt-get install kibana -y
By default, Kibana listens on localhost. So you will need to configure it for external access. You can configure it by editing the file /etc/kibana/kibana.yml:
nano /etc/kibana/kibana.yml
Change the following lines:
server.host: "your-server-ip"
elasticsearch.hosts: ["http://localhost:9200"]
Save and close the file then start the Kibana service and enable it to start at system reboot:
systemctl start kibana
systemctl enable kibana
Install and Configure Filebeat
Filebeat is used to send logs to the Logstash or Elasticsearch for parsing. In this section, we will install the Filebeat and configure it to send logs to the Logstash.
You can install it with the following command:
apt-get install filebeat -y
Once installed, edit the Filebeat main configuration file and configure it to send logs to the Logstash.
nano /etc/filebeat/filebeat.yml
Comment out the following lines:
#output.elasticsearch:
  # Array of hosts to connect to.
#  hosts: ["localhost:9200"]
Uncomment the following lines:
output.logstash:
hosts: ["localhost:5044"]
Save and close the file then start the Filebeat service and enable it to start at system reboot:
systemctl start filebeat
systemctl enable filebeat
Next, enable the Filebeat system module, which will examine local system logs:
filebeat modules enable system
Next, load the index template with the following command:
filebeat setup --index-management -E output.logstash.enabled=false -E 'output.elasticsearch.hosts=["localhost:9200"]'
Finally, verify if Filebeat is shipping log files to Logstash for processing. Once processed, data is sent to Elasticsearch.
curl -XGET http://localhost:9200/_cat/indices?v
You should get the following output:
health status index                             uuid                   pri rep docs.count docs.deleted store.size pri.store.size
yellow open   filebeat-7.10.0-2020.12.06-000001 hkQTgSbhSKqwYV-L6Dirtg   1   1          0            0       208b           208b
green  open   .apm-custom-link                  GZekuSDGSh2h3cyaUh-Kuw   1   0          0            0       208b           208b
green  open   .kibana_task_manager_1            wsc1qi8-S6W7xiU6Gb8IUA   1   0          5           23    125.3kb        125.3kb
green  open   .apm-agent-configuration          OQ0CeuK0R7mXtevKccGjlQ   1   0          0            0       208b           208b
green  open   .kibana-event-log-7.10.0-000001   qt1r0hCbRb6-vYd5UsJVGA   1   0          2            0       11kb           11kb
green  open   .kibana_1                         s7LrkbyERnSezRhyJf-GLw   1   0          9            0     10.3mb         10.3mb
Access Kibana Web Interface
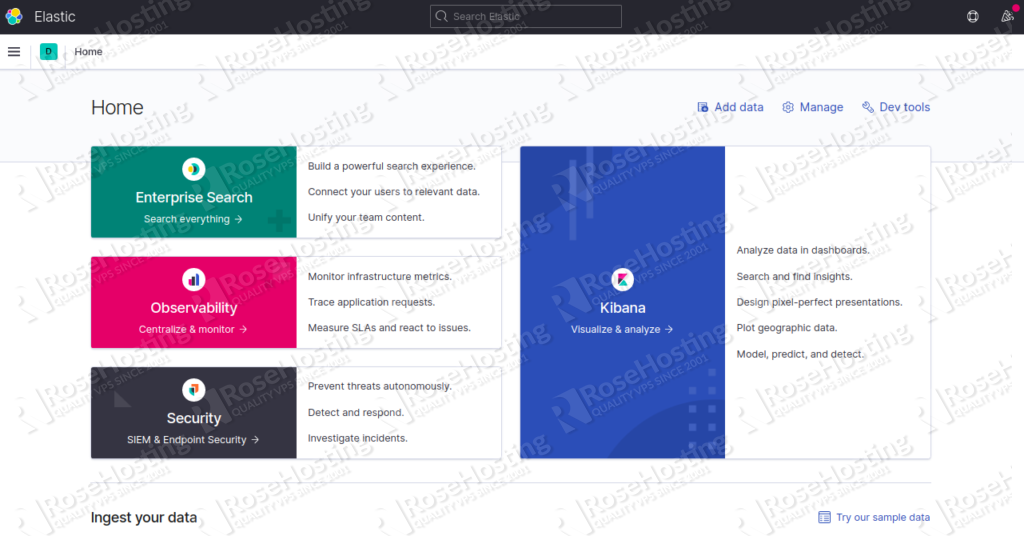
By default, Kibana listens on port 5601. You can access it using the URL http://your-server-ip:5601. You should see the Kibana dashboard in the following screen:

Now, click on the Explore on my own. You should see the following screen:
Congratulations! you have successfully installed ELK Stack on Ubuntu 20.04 server.

Of course, you don’t have to do any of this if you use one of our Linux VPS Hosting services, in which case you can simply ask our expert Linux admins to set this up for you. They are available 24/7 and will take care of your request immediately.
PS. If you liked this post please share it with your friends on social networks or simply leave a reply below. Thanks.
Awesome, Really Helpful.
Very nice blog!! Very helpful
Thank you for giving us this How to install ELK stack with Filebeat.
It runs thru flowlessly.
Thanks for time, effort spent in creating this great “Install ELK stack”
Thanks for the information. I have a question. How to setup kibana to work like https: with an IP address
You can follow one of our tutorials at https://www.rosehosting.com/blog/how-to-enable-https-protocol-with-apache-2-on-ubuntu-20-04/
This guide worked great for me! Do you have a guide for setting up filebeat agents to connect to the ELK stack? I’m having issues getting other machines to send logs to it.
Thank you so much, very helpful