
We’ll show you, How to use traceroute in Linux. The traceroute is a command-line tool that comes pre-installed with Linux and a few other operating systems. Understanding traceroute and the ping command is a must if you want to understand problems like packet loss and high latency. If there is an issue when connecting to an IP/website, traceroute can show us where the problem is. It gives a listing of all the router hops between your computer and a web server. This helps you verify that the routing over the networks in between is correct and quickly determine whether you need to contact your Live Support team.
Table of Contents
1. How Traceroute Works
When you are connecting to a website, the traffic needs to go through a few intermediaries before reaching the website. It goes through the local router, the ISP’s routers, trough larger networks until the final destination is reached.
This tool shows you the path that the traffic takes to reach the website. It also displays every delay that happens at each stop. If there are issues reaching the website and that particular website is working fine, it might be possible that there is a problem on the path between the computer and the website’s servers. This tool would show you where that problem is. Because traceroute requests depend on responses to ICMP requests, some hops on the route may drop requests in favor of higher-priority network traffic.
2. How to Use Traceroute Command in Linux
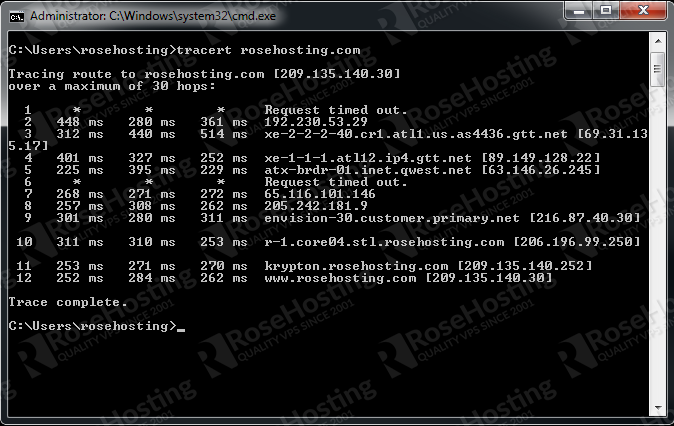
Traceroute can be run from a terminal window or command prompt. Run the tracert command followed with the address of the website. Example, if you wanted to run a traceroute on RoseHosting, you’d run the command:
tracert rosehosting.com
Note: On Linux or Mac the traceroute command is traceroute. In Windows it is tracert.
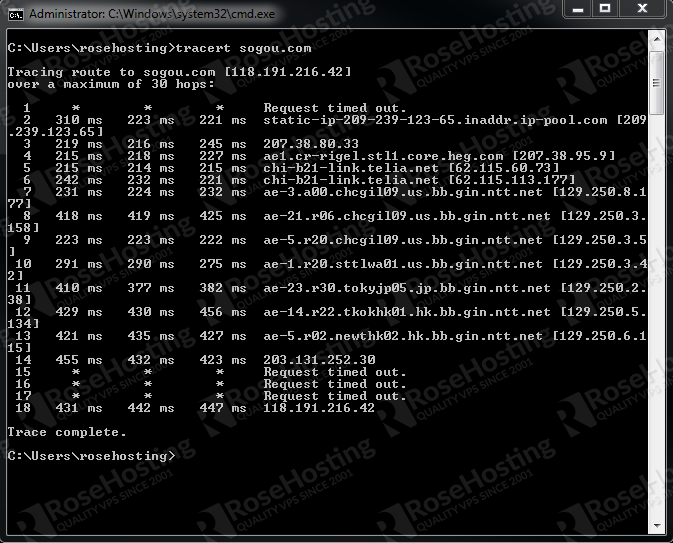
If you are using the traceroute for another website, hosted in a different region of the world, you can see how the paths differ.
The first “hops” are same as the traffic reaches your ISP, later the hops are different as the packets go elsewhere.
The following traceroute command was issued from a RoseHosting instance of CentOS 7 VPS. The arguments -T -p 80 -n perform a TCP-based trace on port 80 and return IP addresses rather than hostnames.
[root@vps /]# traceroute -T -p 80 -n centos.org
traceroute to centos.org (85.12.30.226), 30 hops max, 60 byte packets
1  192.168.1.66  0.024 ms  0.007 ms  0.006 ms
2  206.196.99.249  0.882 ms  1.238 ms  1.590 ms
3  216.87.40.29  0.283 ms  0.347 ms  0.418 ms
4  157.130.167.249  0.920 ms  0.940 ms  0.916 ms
5  140.222.226.55  7.836 ms  7.820 ms  7.808 ms
6  206.82.141.133  13.498 ms  13.301 ms  13.273 ms
7  216.6.81.28  100.643 ms  100.623 ms  100.530 ms
8  63.243.128.69  101.770 ms  100.058 ms 66.198.111.125  101.676 ms
9  216.6.57.1  103.601 ms 63.243.128.38  100.803 ms *
10  80.231.130.33  99.102 ms 66.198.70.174  103.201 ms 80.231.130.33  100.668 ms
11  80.231.131.1  104.306 ms  107.012 ms 80.231.131.157  99.769 ms
12  80.231.131.1  107.260 ms 195.219.194.30  100.670 ms  99.211 ms
13  195.219.194.5  100.108 ms  102.140 ms  99.749 ms
14  85.12.30.226  101.298 ms 195.219.194.5  103.988 ms  102.828 ms
3. Understanding the Output
The basic is self-explanatory. The first line is showing your home router (assuming you have a router), the following lines represent your ISP, and further down each line represents a router that’s further away.
The format of each line is as follows:
Hop RTT1 RTT2 RTT3 Domain Name [IP Address]
Here is what each field means:
- Hop Number: Each time a packet is passed between a router, this is referred to as a “hop.” For example, in the results above, you can see that it takes 12 hops to reach Rose Hosting servers from our current location.
- RTT1, RTT2, RTT3: This is the round trip time (RTT) that it takes for your packet to reach that point and return to your computer (milliseconds). This is often referred to as latency, and it’s the same number you see while using ping. Traceroute is sending three packets to each hop and displays the each time, so you can see how consistent or inconsistent the latency is. If you see a (*) in some of the columns, you haven’t received a response, which indicates packet loss.
- Domain Name [IP Address]: If available, the domain name can often show you the location of a router. If this is not available, you will see only the IP address of the router.
With traceroute, you can get a sense as to which servers on your way to a specific domain or IP address are causing problems.
Now you should be able to use the tracert command and understand its output.
If you have any questionson How to use traceroute in Linux, feel free to comment below or sign up for our hosting services and contact our EPIC Support Team. They are available 24/7 and they will take care of your request immediately.
PS. If you liked this post, on How to use traceroute in Linux, please share it with your friends on the social networks using the buttons bellow. Thanks.